The Unified Modeling Language (UML) is a diagramming notation (language) that lets you visualize systems and software. It’s one of the most popular forms of diagramming in software development and became an ISO standard in 1997. Since then, there have been a few updates to add extra UML diagram types and to support new technologies in programming.
There are two main categories and 14 different types of UML diagrams, each of which is used in a different situation.
Structure diagrams: show the static relationships between the components in the system.
Behavior diagrams: show how the components in the system react to each other, they capture how the system changes, and in some diagrams, how it changes over time.
Use case diagrams in UML are used during the requirements phase of software development – they usually put the system requirements into a diagram format, and it’s easy to see what actions a system must support at a glance. Of course, there will be many use cases for your system, and therefore you will usually need to draw many use case diagrams!
Along with other UML diagrams, such as activity, sequence and component diagrams, use case diagrams help you to visualize your software and requirements, before jumping in and starting to program.
The Unified Modeling Language or UML notation is probably the most well known and regularly used visual representation of programs that you’ll find in software development. There are a wide range of diagrams to help you specify your data and processes before you start programming. They help you clarify requirements and limitations, speed up the implementation, provide a guide for thorough testing, and prevent bugs from sneaking in throughout the entire software development process.
Classes: Each class is represented by a box with three sections stacked on top of each other with the following formatting. Only the class name is mandatory
Class name
Attributes – name: type
Operations – method name(parameter list): return value type
Associations: When a link exists between classes you can indicate it in a number of ways.
Bi-directional: Both classes know about the association – draw a solid line between the classes, with no arrows.
One way: Only one class knows about the other – use an open arrow head. For example: a FailedStudentsList will know about the Student class, but the Student class is not aware of the FailedStudentsList class.
Dependency: When changes in one class cause changes in another class, they are dependent. Use a dashed line to show dependency.
Aggregation: When one class contains several instances of another class, but those instances still exist even if the container class is deleted, then that’s aggregation. Use a hollow diamond to indicate the container class.
Composition: This is similar to aggregation, but when the container class is deleted, the instances of the other classes are also deleted. The container class is ‘composed’ of instances of the other class. Use a solid diamond to indicate the container class.
Multiplicity: Where you indicate how many of each class is related to the other class. This can be zero or more (0..*), one-to-one (1..1), or 1 to a specific number (1..5).
UML sequence diagrams are the first highly detailed behavioural diagrams that you will create when using UML for software development. They aren’t so often used in business process modelling, especially because they refer to the actual data and operation names that will be used when programming. That doesn’t mean you can’t use sequence diagrams: they can be used to model business objects and their interactions in detail, or by IT staff to detail how the elements in their infrastructure communicate and work together.
Sequence diagrams take the classes with their data and operations, plus the general behavior modeled in the activity diagrams, and show how it all fits together. Apart from parts of the actual interface, you could write your program from the combination of the class and sequence diagrams!
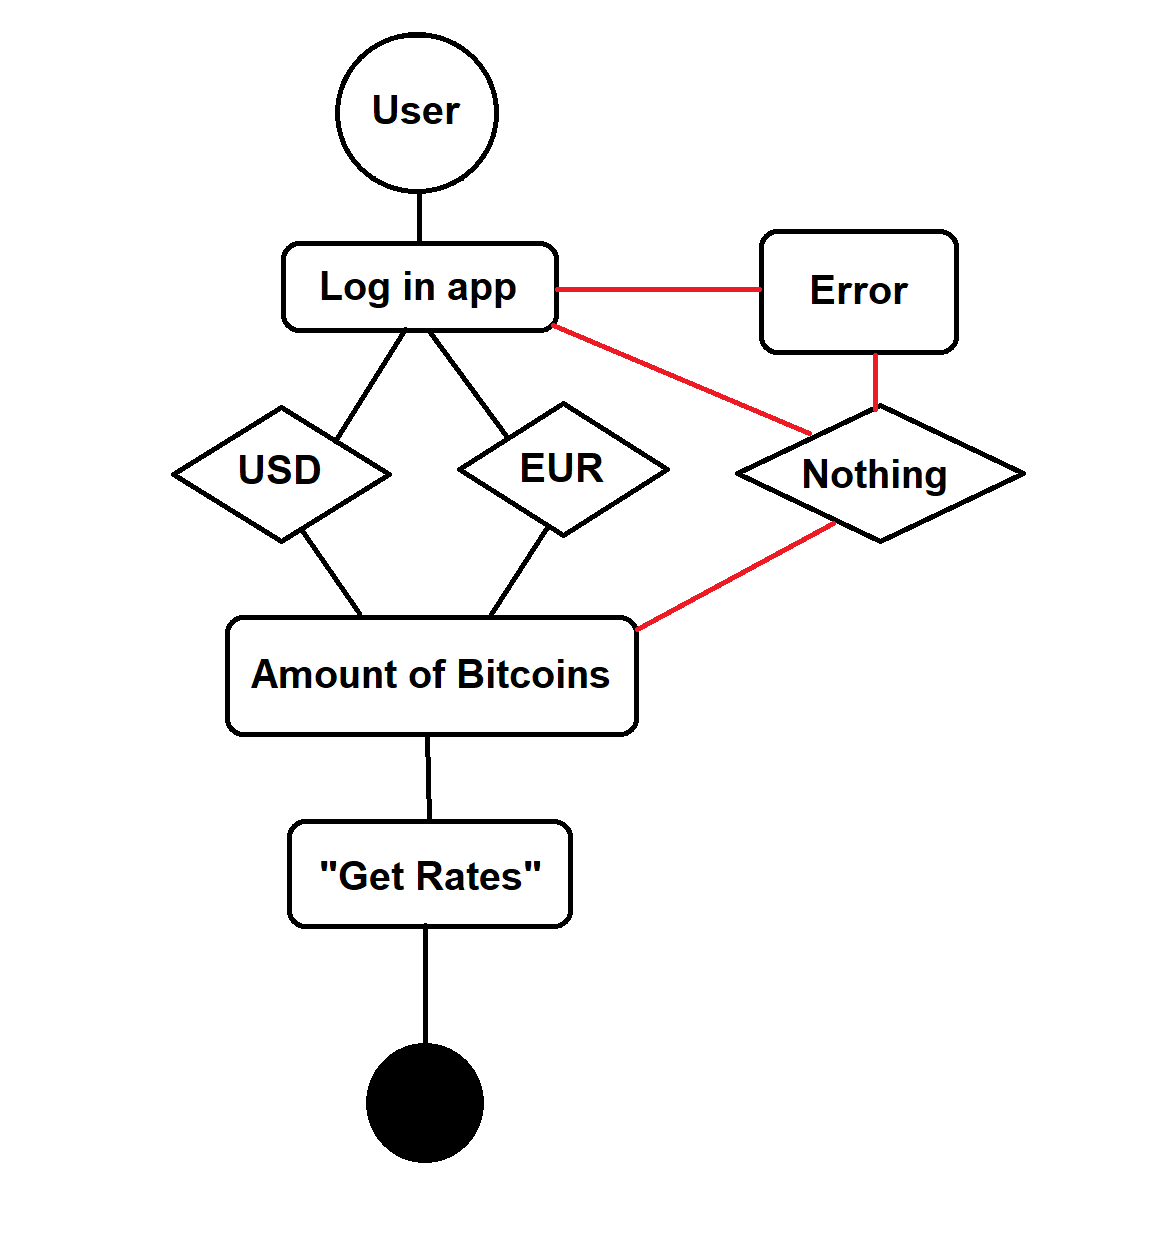
Like use case diagrams, activity diagrams model the behaviour of users and systems as they follow a process. They are a type of flow chart or workflow, but they use slightly different shapes.
Start/End: Use a black or solid circle to show where the diagram starts, and a solid circle with a ring around it to indicate the end of the process.
Actions: Use rounded rectangles with the name of the action.
Decisions: Use diamonds whenever there is a choice. You can either include the decision as a question within the diamond, or indicate the decision outcome on the outgoing arrows instead of simply using yes/no labels.
Split/Join: Use a thick bar to indicate where activities split or join.
State diagrams diagrams have been used in programming to describe the various possible states that a system can be in for decades. They also quickly show which states lead to each other, and what triggers a change of state.
The biggest difference between state diagrams and activity or interaction overview diagrams is that state diagrams do not (necessarily) show the sequence. They just show what states are possible and their entry and exit points, not when those states are entered.
Components of UML state diagram
Start state: A solid circle.
End state: A solid circle with a ring around it.
State: A rectangle with rounded corners, with the name of the action.
Transition: Connector arrows with a label to indicate the trigger for that transition, if there is one.
State with internal activities: A state with a horizontal line, and the actions listed in the bottom half.
Composite state: A state with a horizontal line, and a nested state diagram (or link to another draw.io page) in the bottom half.
Guards or conditions: A diamond.
Fork: A thicker line with one transition incoming and two or more outgoing.
Join: A thicker line with more than one transition incoming and only one outgoing.
These UML diagrams are a combination of an activity diagram and sequence diagrams. Each individual activity or interaction is placed in its own frame, making it easier to see the different paths that need to be programmed when there are complex if-then-else decisions. Decisions are outside of the frames to show the flow of control between the various interactions.
The interactions themselves, inside the frames, are very similar to sequence diagrams. Between the interactions you will have decisions (diamonds) and fork and join nodes (solid horizontal rectangles), and connectors to show the flow of control. There are also initial and final nodes to show the start and end of the overarching interaction.